Minneapolis has an abundance of parkland, but how equitably is it accessible to people of color and low income residents?
My home city of Minneapolis prides itself on its park system, which has consistently ranked highly in the Trust for Public Lands’ survey of cities in the United States. Minneapolis has a long history of emphasizing and investing in parks of all types, including playgrounds, community gardens, walking and bike trails, and bodies of water. I am surrounded by multiple parks, which were incredibly fundamental to my childhood. Not everyone in Minneapolis, however, is lucky enough to have a similar experience.
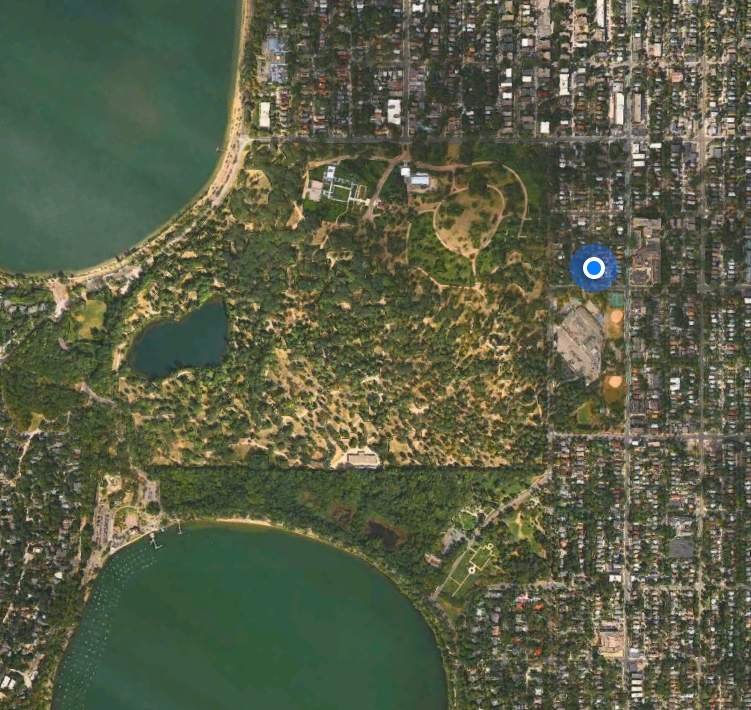
The stated goal of the Minneapolis parks system is to have a park within a quarter mile of every resident and a recreation center within a half mile. Parks are supposed to be public resources open to all residents regardless of race or economic status. This goal is dated back to our most influential parks superintendent, Theodore Wirth, who held that position for much of the early half of the twentieth century.
Like most American cities Minneapolis has a history of housing segregation that includes practices such as redlining, restrictive housing covenants, and discrimination that persists into the current makeup of the city. Despite increases in diversity and attempts to provide more equitable housing the city is still fairly segregated.
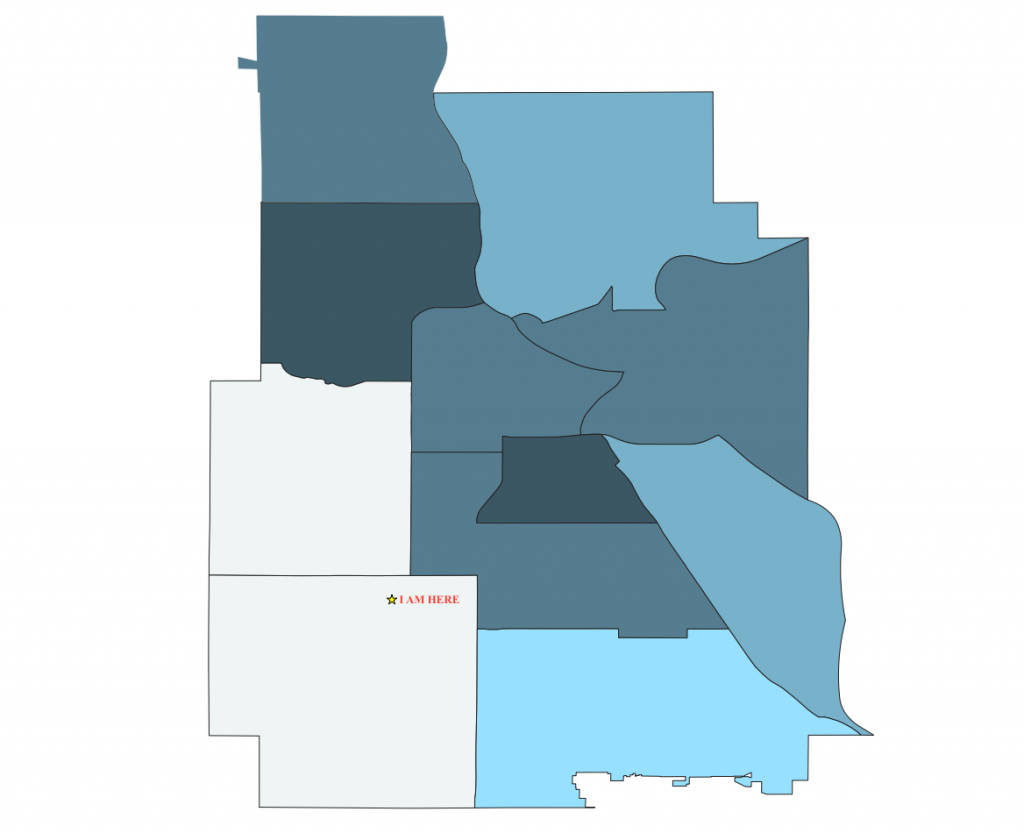
Medium Blue > 35%-65% people of color
Light Blue > 25%-35% people of color
Sky Blue > 17%-25% people of color
White 12%-17% people of color
Data from Minnesota Compass
Comparing the percentage of people of color in a given community and the amount of green space within the boundaries shows a pattern of disparities in physical proximity to parks for areas that have predominantly residents of color.
The map of racial distribution in the city also shows disturbing patterns with regards to how the median household income relates to the racial makeup of a community.
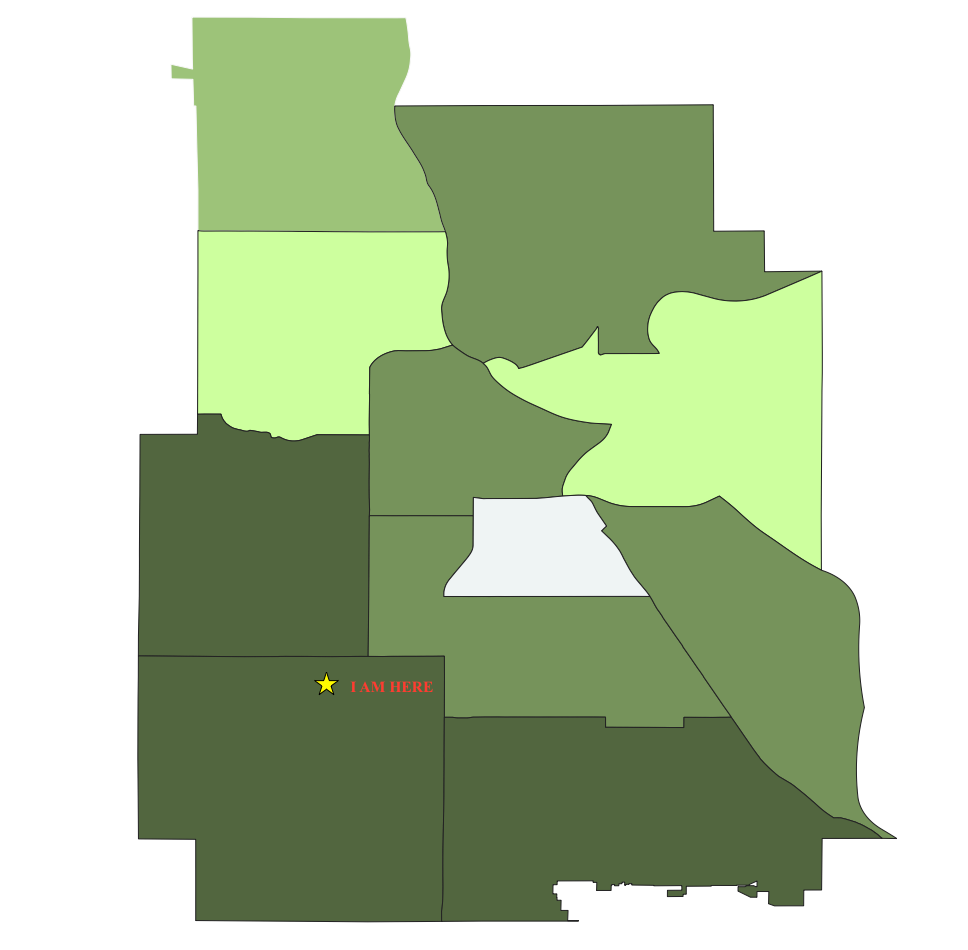
Medium Green > $50,000-$60,000
Light Green > $40,000-$50,000
Mint Green > $35,000-$$40,000
White $27,000-$35,000
Data from Minnesota Compass
The same majority minority areas that had less access to the city’s parks are also home to the lower income residents. People in Minneapolis who are people of color, economically disadvantaged, or both (there seems to be a large overlap based on this data) have less access to the park system despite its stated goal of equitable access for all regardless of race or economic status. This does not even begin to take into account the possibility of disparities of park quality and available resources that may further exacerbate these inequalities.
Sources: Minneapolis Parks and Recreation Board, Minnesota Compass, Apple Maps, The Trust for Public Lands